 To create interesting 3D Graphics which are easy to understand you can use PROC GCOUNTOUR.
With this procedure you are able to create graphics for your next presentation or for playful marketers.
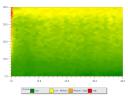
The following Code and the picture are an example how to create Contour Plots:
data surface;
do i=1 to 50 by 1;
x=i;
do k=1 to 50 by 1;
x=x;
y=k;
z=round(sqrt(5*y*(x**2)+3),1);
output;
end;
end;
run;
GOPTIONS xpixels=800 ypixels=600;
GOPTIONS CBACK=WHITE;
LEGEND1
LABEL=(FONT=‚Arial‘ HEIGHT=8pt JUSTIFY=CENTER ‚Revenue:‘ )
POSITION=(MIDDLE BOTTOM OUTSIDE)
across=4
down=1
value=(tick=1 height=5.5pt JUSTIFY=LEFT ‚Low‘
tick=2 height=5.5pt JUSTIFY=LEFT ‚Low – Medium‘
tick=3 height=5.5pt JUSTIFY=LEFT ‚Medium – High‘
tick=4 height=5.5pt JUSTIFY=LEFT ‚High‘)
CSHADOW=GRAY
CFRAME=CXE8E8E8
CBORDER=GRAY;
TITLE ‚Contour Plot‘;
TITLE2 ‚PLOT: x * y * sqrt(5*y*(x**2)+3)‘;
PROC GCONTOUR DATA = surface;
PLOT x * y = z /
PATTERN
LEGEND=LEGEND1
NLEVELS=4
SMOOTH
CFRAME=WHITE
CLEVELS=GREEN YELLOW ORANGE RED
;
RUN;
QUIT;
TITLE; TITLE2; FOOTNOTE;